HVAC CFD Airflow Study
How good is the TotalSim US office airflow in protecting staff from aerosol contaminants?
Concerns about the aerosol spread of Covid-19 got engineers at TotalSim thinking. As a CFD* consultancy, we have the tools to evaluate the airflow in our own office to see how well our own HVAC system circulates the flow around the space but it is not something we would normally take the time to do. Although most of our staff is still working from home (as many people currently are), we wanted to study our office airflow patterns and determine how long it takes the air in each part of the office to refresh. Maybe the study results will make our staff more comfortable when the time comes to return to the office.
Office Layout
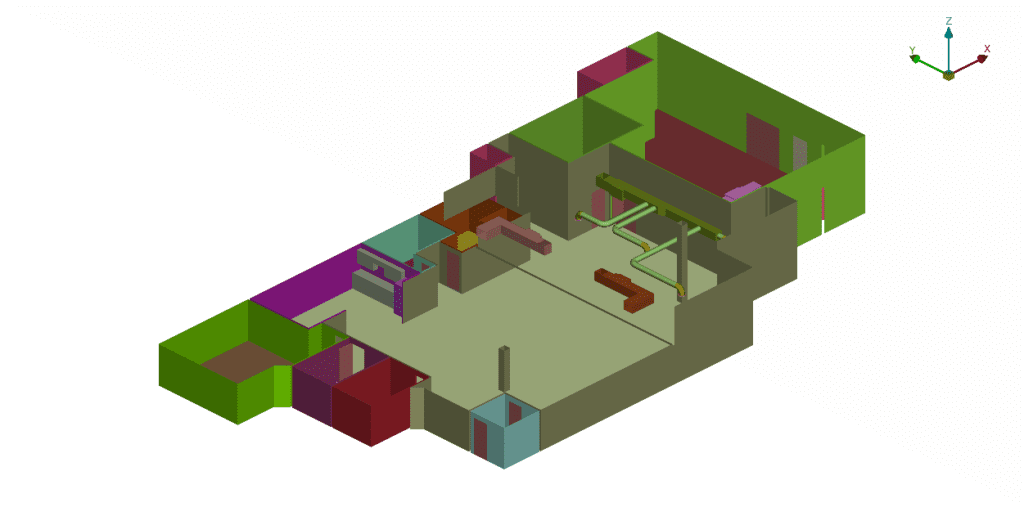
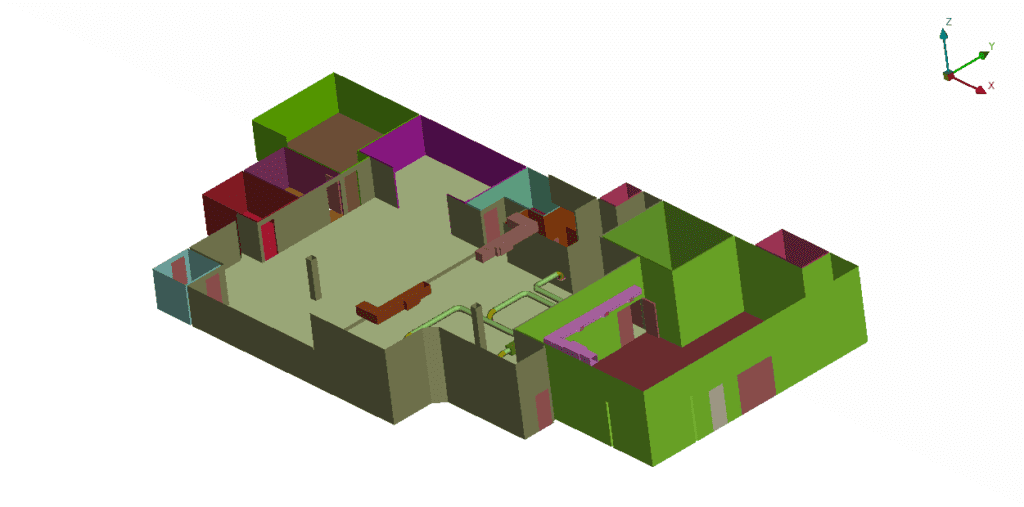
For this evaluation, we decided to keep it relatively simple by including only the walls and the HVAC systems. These images show the office layout (ceiling removed). TotalSim has an open office plan with a drop ceiling covering half the space and then high ceilings on the other half with the HVAC systems suspended from the ceiling. In the rear of the office there is a “flex” space to allow for activities like 3D scanning, etc with a separate HVAC unit.
Office plans and HVAC schematics were used to create 3D geometry using BETA CAE’s ANSA pre-processing software. For this initial test, furniture was not included. To save time some supply vent covers and some of the HVAC circular components were imported from GrabCAD – using components that best represent what is in our offices. Additionally doors were left open from the two private office spaces, the conference room and the flex space to allow free airflow from one space to another. Spaces that have no ventilation or have independent ventilation (the server room) were sealed off from the main volume. This included the restrooms as the doors are most often shut on those spaces and they have independent ventilation fans.
Assumptions
- The airflow rate provided by each of the HVAC units is delivered equally to each of the supply vents connected to it. For example a 1800 cfm unit supplies 9 vents so each vent moves 1/9 of the total flow volume. No losses are included for the duct system.
- The office is a closed system. There is no air leakage (infiltration or exfiltration) into or out of the office from unintentional openings (cracks) or from the use of doors.
- The HVAC system fans are continuously running – moving the maximum amount of air.
- The air is incompressible, isothermal, steady and turbulent.
- No buoyancy effects due to thermal gradients in the room are modeled.
Computational Method
Surface mesh was created in ANSA and then an automated meshing tool adapted from standard Snappy Hex Mesh (from the OpenFOAMⓇ toolset) was used to create the volume mesh. The mesh size inside the volume was not allowed to exceed 31.25mm in length. Mesh refinement was included around the supply vents as these have small openings and require a smaller mesh to capture the detail. Refinement was added near the drop down ceiling to help capture air flow details along the ceiling coming from the vents that angle airflow to the sides as it leaves these supply vents. Final mesh size was a little over 116M cells.
A Reynolds-averaged Navier-Stokes (RANS) solution was completed with the OpenFOAM simplecFOAM solver and k-omega SST turbulence model.
Air changes per hour (ACPH or AC/hr) is used to assess the ventilation of the space. It is calculated from the residence time for air to travel from an inlet to each point in the volume.
Results
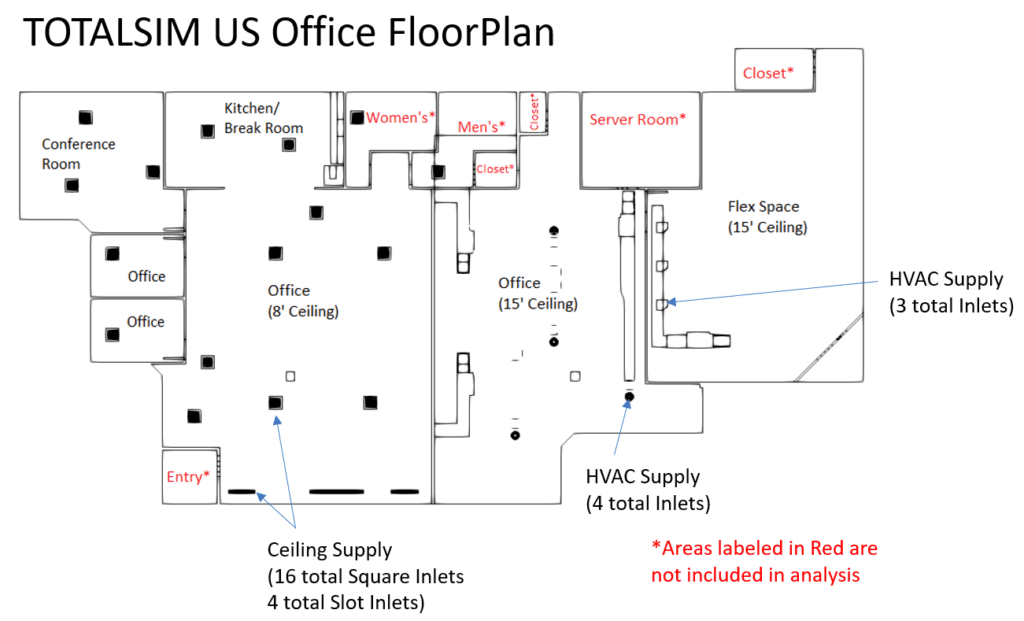
For reference, the office floor plan is included below. Notice that there are several spaces that were not included in the analysis as discussed above.
The following movies show the office airflow patterns. Note that the velocity range is from 0 to 1m/s. The flow from the ceiling vents tends to move along the ceiling until there is an obstruction or a place where the airflow intersects the airflow from another vent.
The airflow from the vents labeled “HVAC Supply” in the floorplan above have a higher velocity than the dropdown ceiling vents as can be seen when the slices in the movies cross by those supply vents. This is expected because there are fewer supply vents for those particular HVAC units and so the HVAC unit’s total flow rate is divided by this lower number of vents.
The next movies show iso-surfaces of air change rates using two different methods.
This first movie shows steps of air changes per hour (AC/hr or ACPH) where inside each surface the air change rate is less than or equal to the ACPH label for each step through a maximum of 10 AC/hr. This set of images makes it easy to see the areas where there are lower air changes. There are some isolated areas where the air change rates are lower than 4.5 AC/hr. These locations are not where staff are spending time as they are located above 8 feet high. Much of the flex space has 5-6 AC/hr ventilation rate.
The second iso-surface movie is opposite the first. It shows the steps of AC/hr where inside each surface the air change is greater than or equal to the ACPH indicated at each step. Much of the main open office space has air changes more than 8 AC/hr. There are pockets where the circulation is better than 10 AC/hr especially in the individual office spaces.
Note in the above movie the flow close to the supply vent locations have high air change rates. This is because the air moves away from the supply vents in a consistent manner and so the air will cycle through those areas quite quickly.
In addition to the movies already shown individual images (volume slices) were generated for velocity and AC/hr throughout the computational volume. The following images show the AC/hr slices that are at head level when sitting and at head level when standing. Obviously the air change rates in these zones are the most impactful to staff going about their daily work.
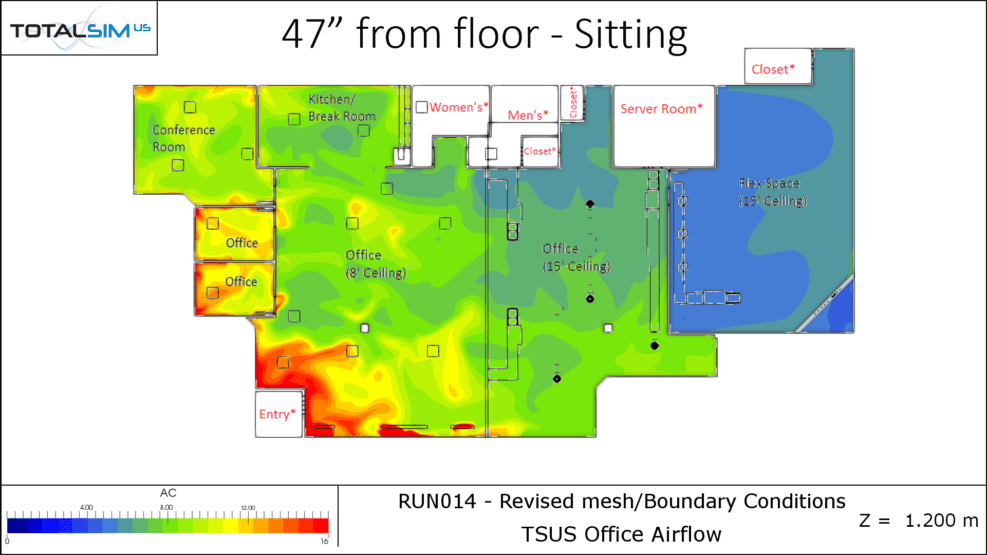
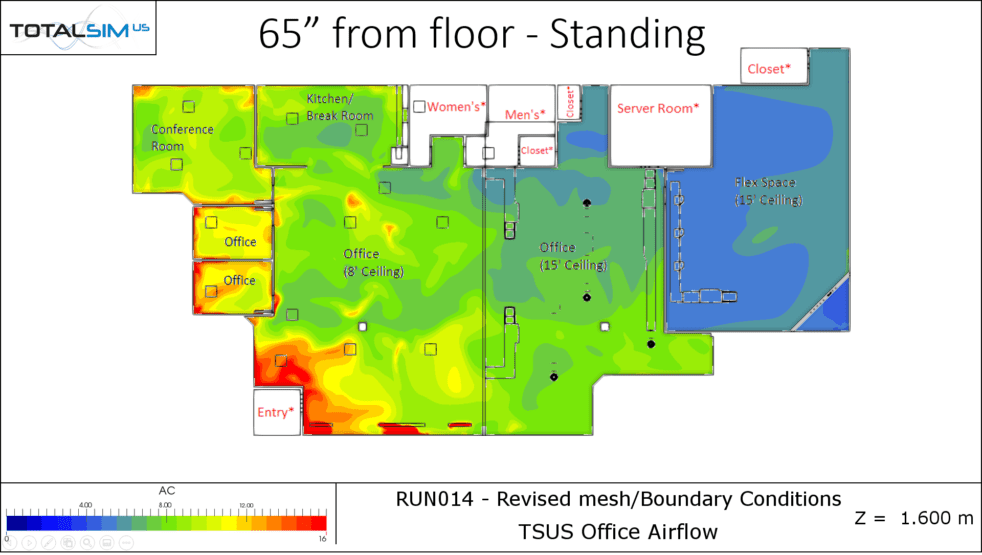
These images give a more detailed view of the results at desired locations from the floor and show there is very little difference between the air change rates whether sitting or standing. The air change rate in the open office dropped (8’) ceiling section is generally better than just under 8 AC/hr. However, there is a pocket in the break room that is closer to 7 AC/hr. The private office spaces all show better than 10 AC/hr and the conference room is better than 8 AC/hr except a very small zone that is across the room from the door. Where the main office ceiling is 15’ high, the area that sees the least amount of air changes is in the hallway going back to the utility closet having a 5 AC/hr worst case (seen in the image that is 65” from the floor). The rest of the 15′ ceiling office space has 7-8 AC/hr. And, as already mentioned, the flex space has the lowest air change rate of 5-6 AC/hr.
Summary
The final question to answer is “How good is the TotalSim US office airflow in protecting staff from aerosol contaminants?” And the answer seems to be ‘good’ and better than expected.
ASHRAE standards for indoor air quality focus on having suitable fresh air for breathability and rely on occupant density and room size. Using the recommended guidelines for office spaces (5 cfm/person and 0.06 cfm/ft2) and assuming 20 people in the office, the recommended air change in the TSUS office is well below 1 AC/hr. This low number is mainly due to the size of our office. However, these guidelines do not take into account the need to refresh the air to limit the transmission of airborne viral diseases as is happening during the Covid-19 pandemic.
As an alternative standard, some researchers have adopted the CDC standard for Airborne Infection Isolation hospital units that require a minimum of 6 AC/hr (for older settings) or 12 AC/hr (for new build) as a measure for ventilation rates. From our results, the TotalSim office has consistent ventilation near 8 AC/hr in the area where most of the staff is situated. While this is not at the ideal level of 12, it is better than we expected prior to conducting the study. Prior to this study, we thought the private offices and the conference room would have the worst ventilation but it turns out they have the best. This just goes to show that conducting a study is the best way to know what is actually happening and that intuition doesn’t always work.
It is worth noting that all of our air change rates were computed assuming that the HVAC fans are running continuously and if they were left to cycle based on temperature demand, then the air change rates would drop accordingly. Therefore, it is recommended that the fans are set “on” during occupied office hours for maximum benefit.
If it were not for the pandemic, we would not have taken the time to analyze the TotalSim office airflow patterns. This project was rewarding as it directly impacts our office and the our staff’s peace of mind. Additionally, it was interesting to see where the results matched our preconceived ideas and where they didn’t.
Future Studies
After having completed a baseline case, we would like to investigate additional questions like the following:
- How does the mesh size/distribution affect the solution? Can we get away with a smaller mesh size and still have high quality results?
- What changes do we see when we include furniture and/or staff?
- What happens to the airflow if you open exterior doors and generate a breeze through the space?
- Can we improve our ventilation pattern by making changes to the way the HVAC system operates?
- By adding or taking away some of the supply vents?
- By reconfiguring the return vents in the drop down office space to use the plenum that is currently not in use?
Would you like to learn more about your office airflow patterns? Contact us to discuss it.
*What is CFD?
Computational fluid dynamics (CFD) is a branch of fluid mechanics that uses computer numerical analysis and data structures to analyze and solve problems that involve fluid flows, typically solved on large supercomputers. Fluid mechanics plays a significant role in the engineering process when developing new designs. Analyzing the aerodynamic and thermal qualities of a product using experimentation is a well-established approach however experimentation can be costly, limiting, time-consuming, and difficult to execute especially on a large scale. Progression of computing power has allowed the field of CFD to prosper acting as a complement to physical testing and in some cases replacing it. CFD is the science of predicting fluid flow, heat transfer, mass transfer, chemical reactions, and other flow properties by solving governing fluid flow equations using numerical methods. Across the industry, CFD is routinely used to drive product development, troubleshoot issues, study and optimize new designs and concepts, and map performance. CFD methods are heavily used across many disciplines with motorsports being a leading proponent.
