Background
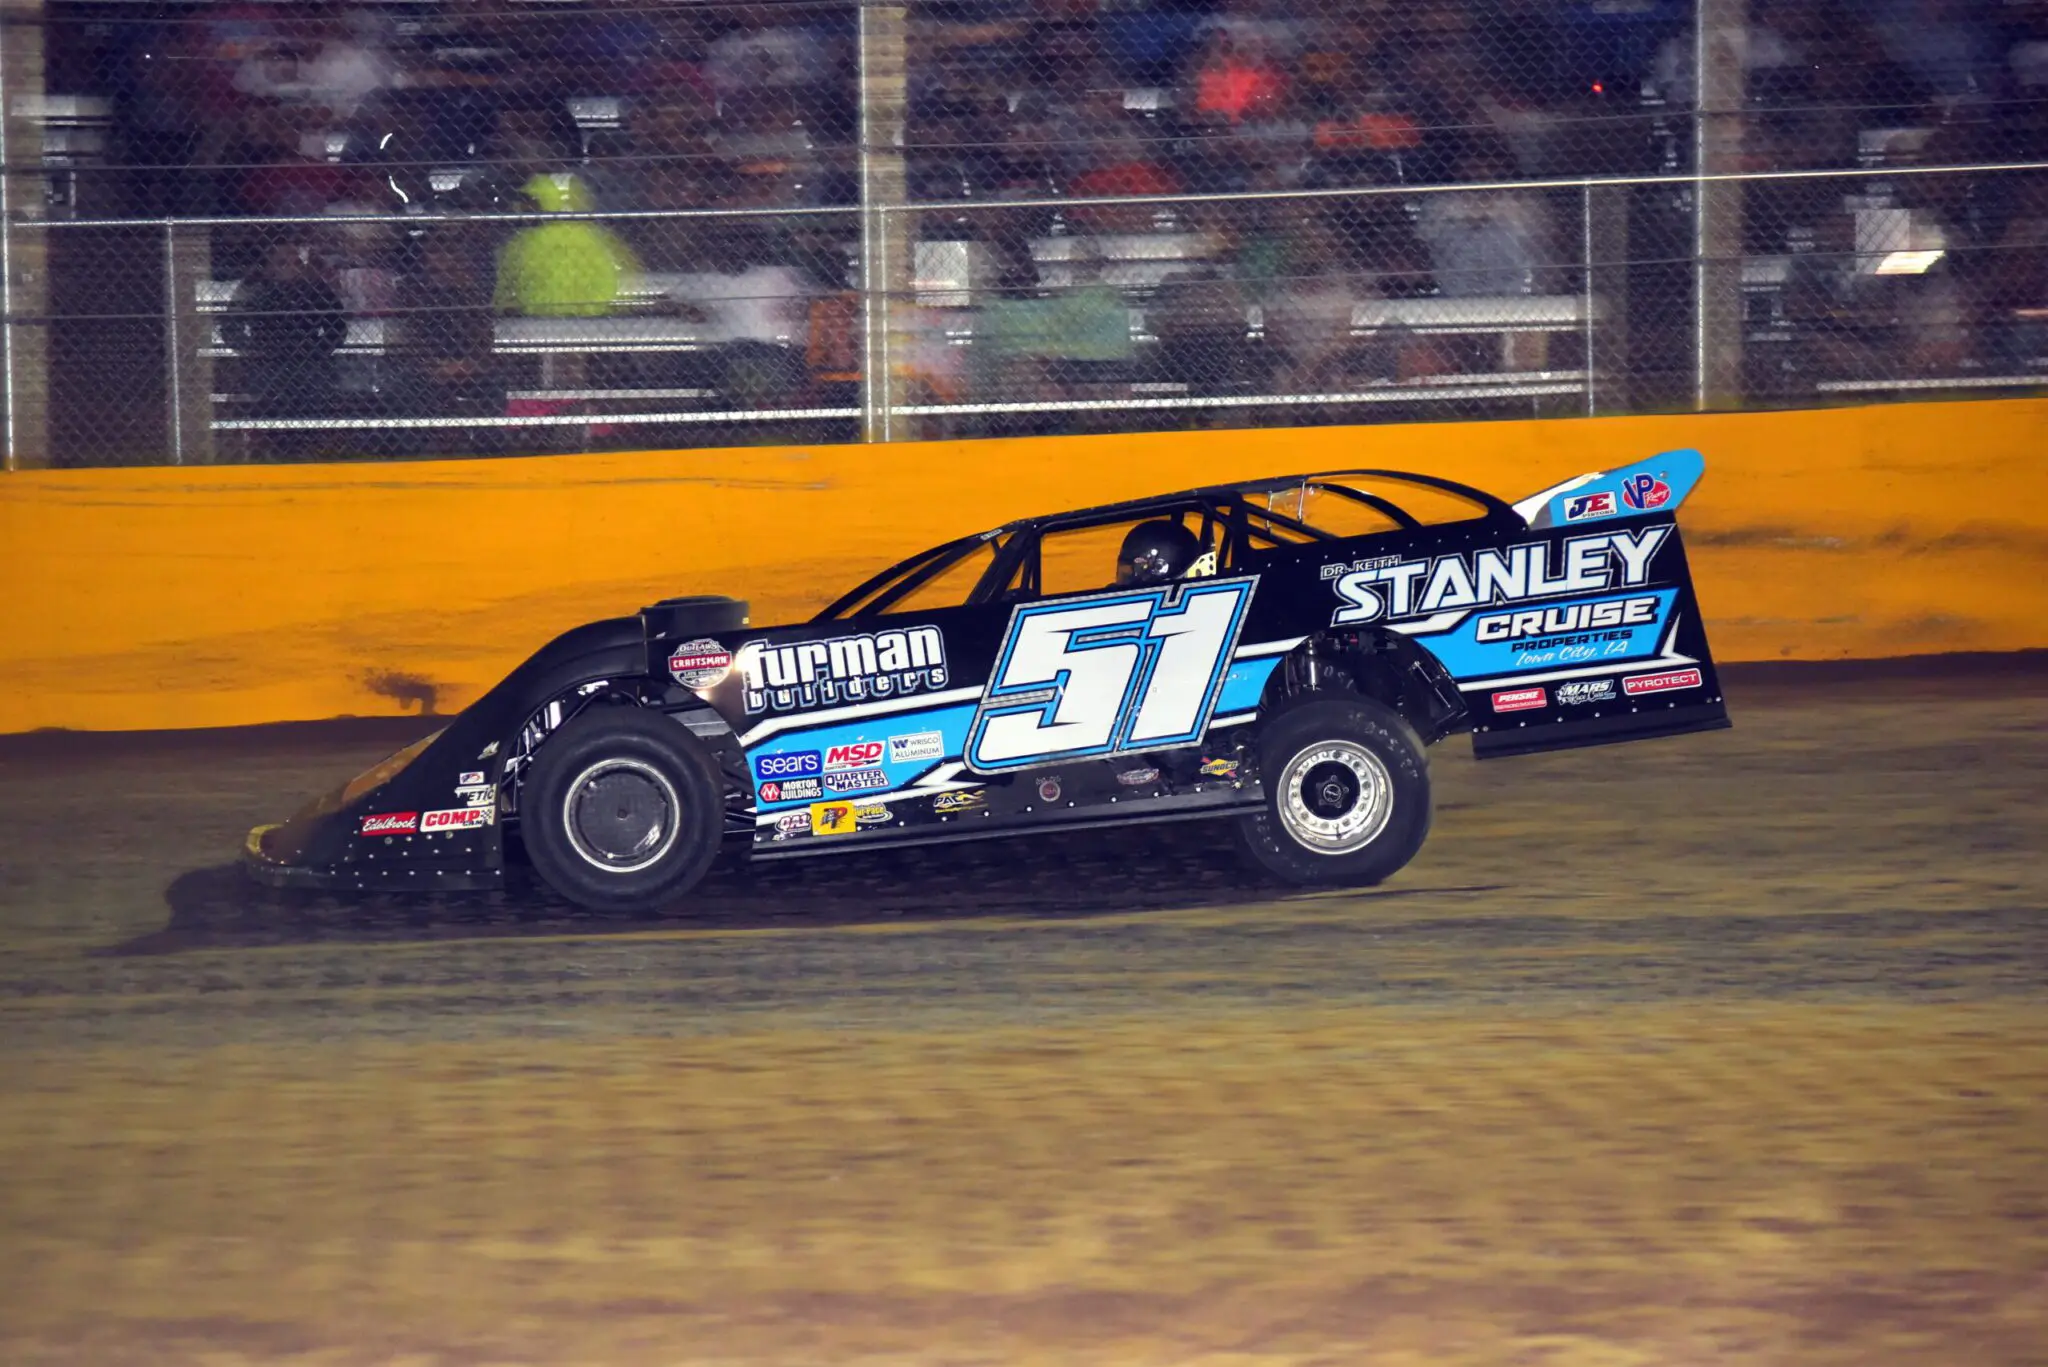
Dirt track racing is a popular form of automotive racing in the United States. Dirt Late Model is a unique vehicle, with its inclined nose, flat doors, large spoiler, and open backs. With a minimum weight of a Dirt Late Model at around 2,300 lbs, these vehicles require a powerful engine producing over 800 horsepower to allow the vehicle to achieve high acceleration and speeds. From the tight wheel arches to the angle and location of the rear spoiler to the different fender heights, every design component of this vehicle influences aerodynamics. Wind tunnel testing for this type of vehicle is difficult due to the extreme yaw (side slip angle) the cars experience while cornering. Without the constraints of the wind tunnel, Computational Fluid Dynamics (CFD) methods are ideal for testing and understanding the aerodynamics of these dirt racing cars.
What is CFD?
Computational fluid dynamics (CFD) is a branch of fluid mechanics that uses computer numerical analysis and data structures to analyze and solve problems that involve fluid flows, typically solved on large supercomputers. Fluid mechanics plays a significant role in the engineering process when developing new designs. Analyzing the aerodynamic and thermal qualities of a product using experimentation is a well established approach however experimentation can be costly, limiting, time consuming, and difficult to execute especially on a large scale. Progression of computing power has allowed the field of CFD to prosper acting as a compliment to physical testing and in some cases replacing it. CFD is the science of predicting fluid flow, heat transfer, mass transfer, chemical reactions, and other flow properties by solving governing fluid flow equations using numerical methods. Across industry CFD is routinely used to drive product development, troubleshoot issues, study and optimize new designs and concepts and map performance. CFD methods are heavily used across many disciplines with motorsports being a leading proponent.
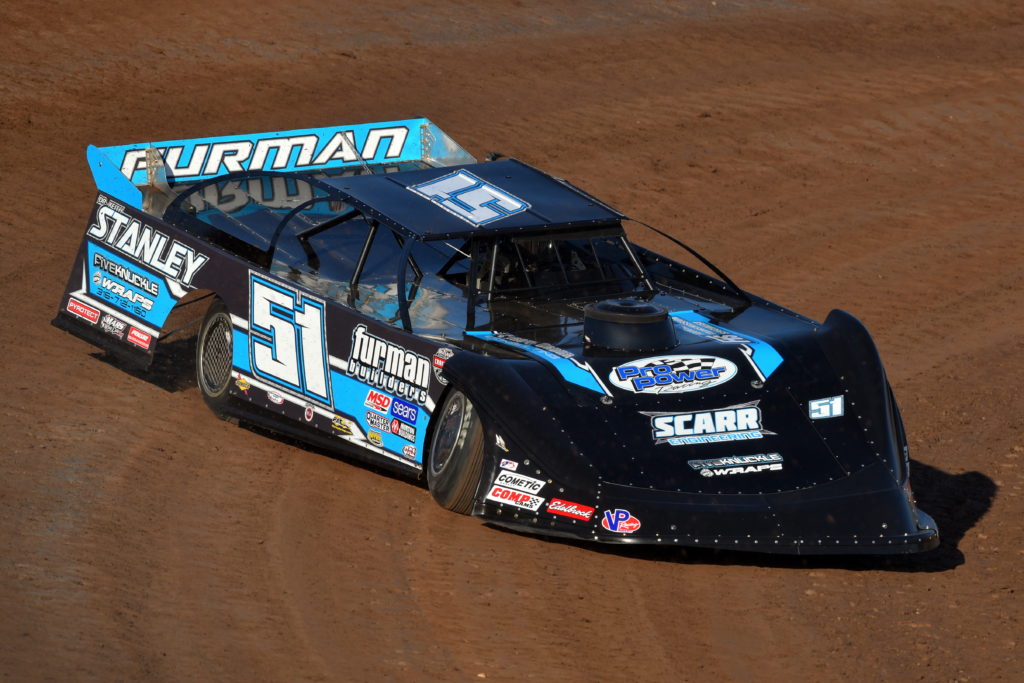
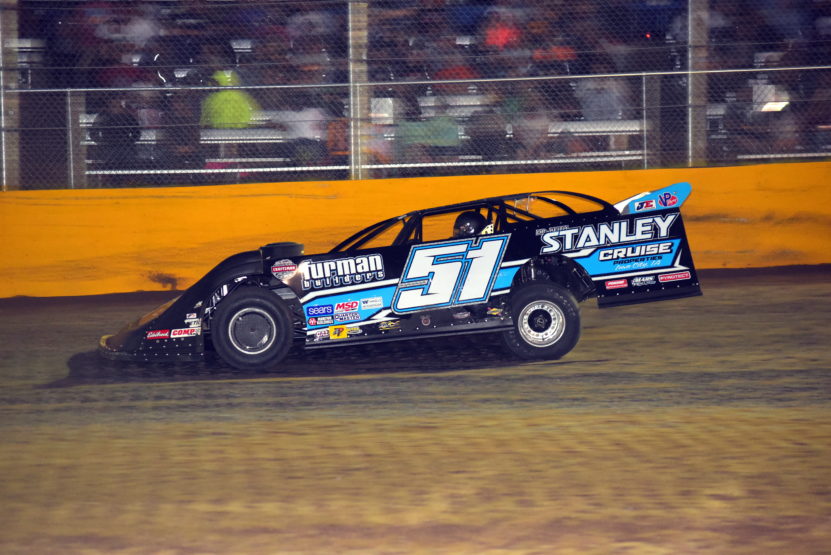
Dirt Late Model by ‘Photo by Boyd’ [1]
The Dirt Late Model CAD was drawn by Matthew Furman [2], who is a mechanical engineer and also the owner and driver of the car. The digital twin was created using Siemens NX with Siemens Simcenter CAE Simulation. Matt was first interested in modeling the vehicle dynamics and analyzed this using the dynamics program Simcenter 3D Motion (read more on Matt’s collaboration on vehicle dynamics with Claytex US here). When it came to looking at the critical aerodynamics of the car, Matt turned to TotalSim to help analyze the car. Matt’s CAD model was imported directly it to TotalSim’s TS Auto App, run conditions selected, and the meshing and CFD solve were automatically executed by the App in TotalSim’s cloud infrastructure. The Apps automated results were evaluate by TotalSim engineers to help characterise the aerodynamics performance.
Run Conditions
The simulation was configured to capture a mid corner speed of 100 mph with a side-slip of 15 degrees. This is typical of the cornering conditions Matt experiences at several tracks during the racing season. Of course the entire vehicle needed to be modeled (as opposed to a half-car model) to capture the asymmetry of the car and the large yaw angle.
Run Stats
- Vehicle CAD file from Siemens NX was prepped and processed via Beta CAE’s ANSA v18.10.
- Simulation executed using the TS Auto App (see below for more information about TS Auto)
- Meshed with snappyHexMesh
- Vehicle was meshed and solved on 112 cores
- Mesh Size: 88.5 million cells
- Mesh Time: 1.10 hrs on 112 cores
- Solved using TotalSim’s version of OpenFOAM (simplec solver)
- Solve Time: 9.56 hrs on 112 cores
Analysis
Aerodynamic Forces
The simulation reported 607 lbs of drag and 1105 lb of downforce (negative lift) at the 100 mph speed we set. The downforce is quite high, which will obviously help the traction through the corner, but the drag is also high which will impact acceleration and top speed. What is very impressive is the amount of sideforce the car is creating with a whopping 703 lbs acting to push the car to the drivers left, stabilize the car in the corner.

Cp Plots
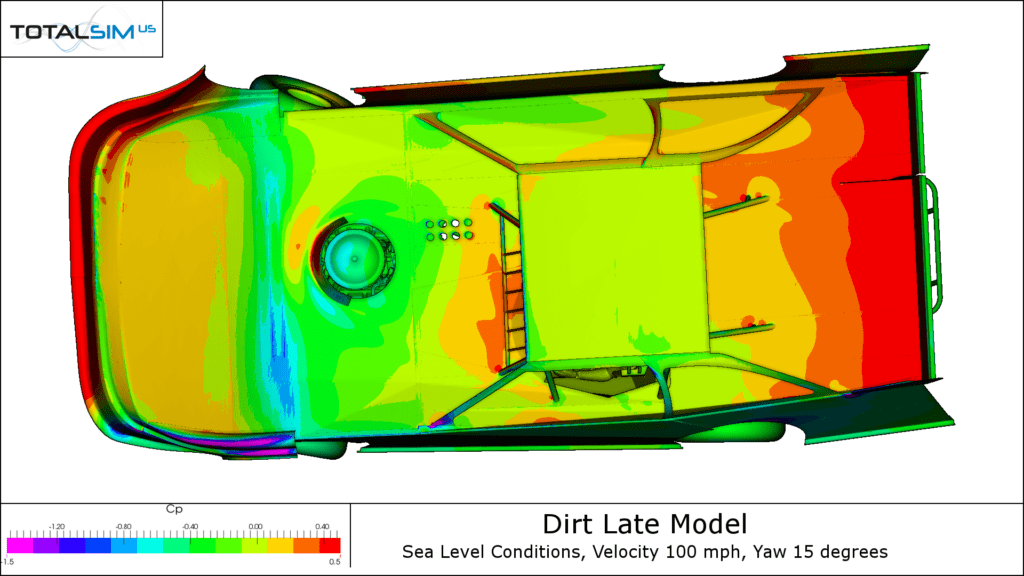
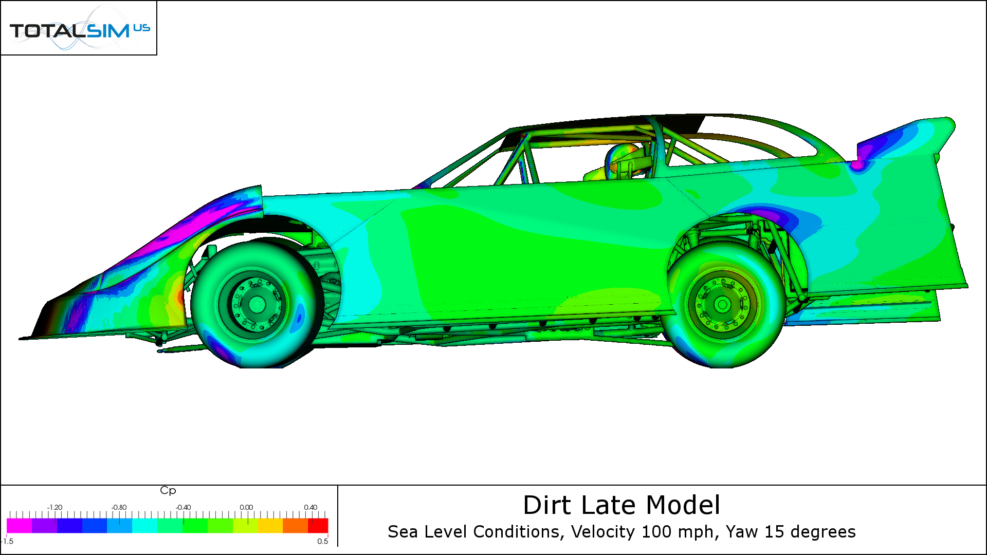
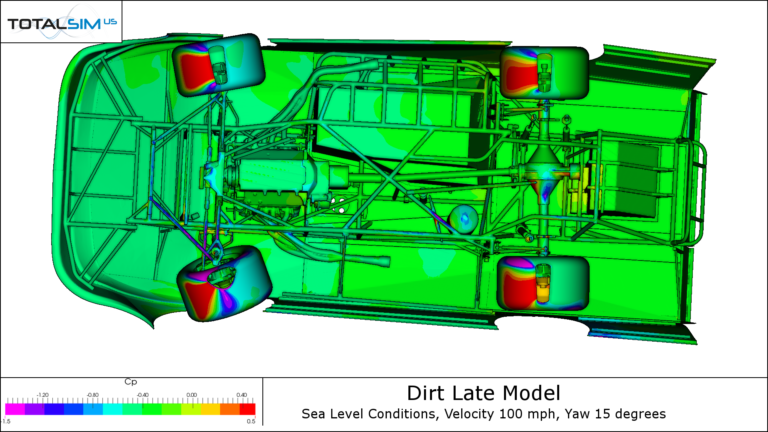
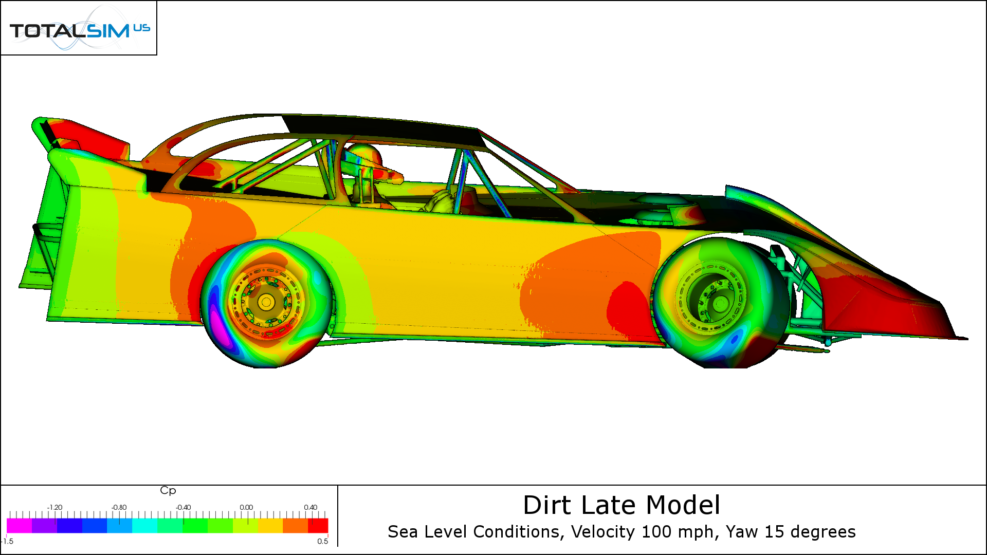
To understand how these forces are being created we can look at the pressure distribution on the vehicle. Reds and yellows show areas of high pressure and blues and purples show where the pressure is low . We can determine how the pressure influences downforce, drag and sideforce by isolating the pressure acting in the vertical, longitudinal and lateral directions respectively.
CpX Plots
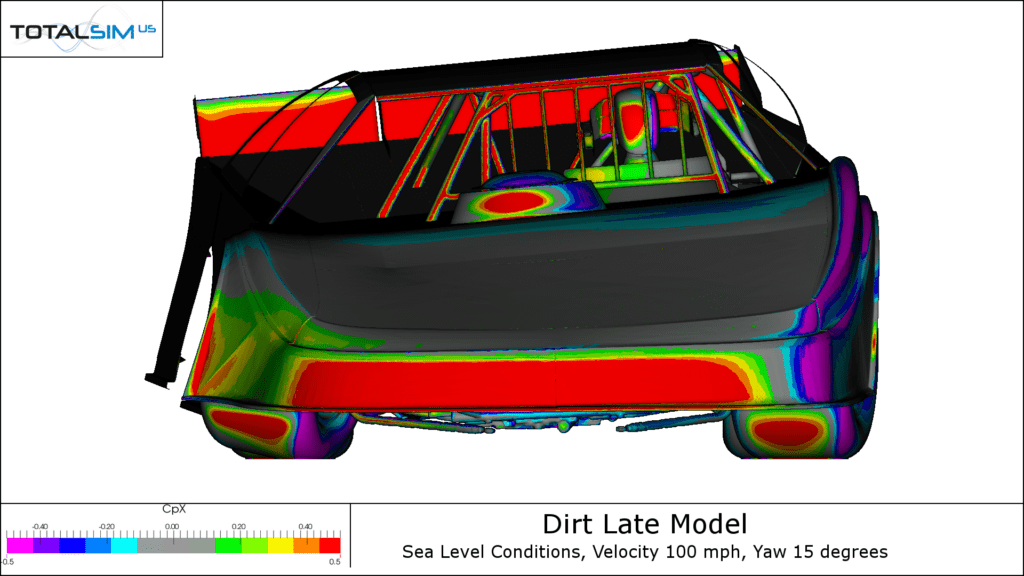
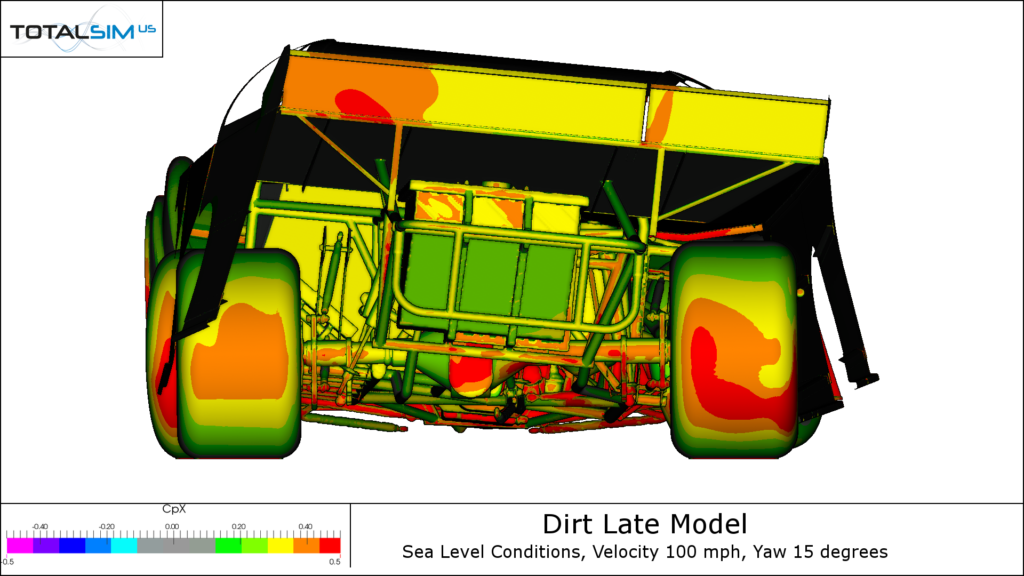
The CpX plots isolate the pressure effects in the longitudinal direction and show how the pressure is creating drag. Values above zero (reds and yellows) show drag while values below zero (blue and purples) show thrust. In the images above above, you can see drag coming from the nose, the wheels and the spoiler, with some thrust coming from the driver-side fender. These happen to be the same areas that were creating downforce and lift in the CpZ plots – this is a typical relationship i.e. when you create downforce unfortunately you usually create drag too.
The ratio of downforce to drag created is called the Aerodynamic Efficiency (or L/D which on this run is 1.82) Each race track will have an optimum Aerodynamic Efficiency for each class of car running there. For the majority of the tracks Dirt Late Models race on, and considering the horse power available, top speed is less of a concern than cornering speed, so the Aerodynamic Efficiency can be skewed toward more downforce at the expense of drag.
Drag X-Ray
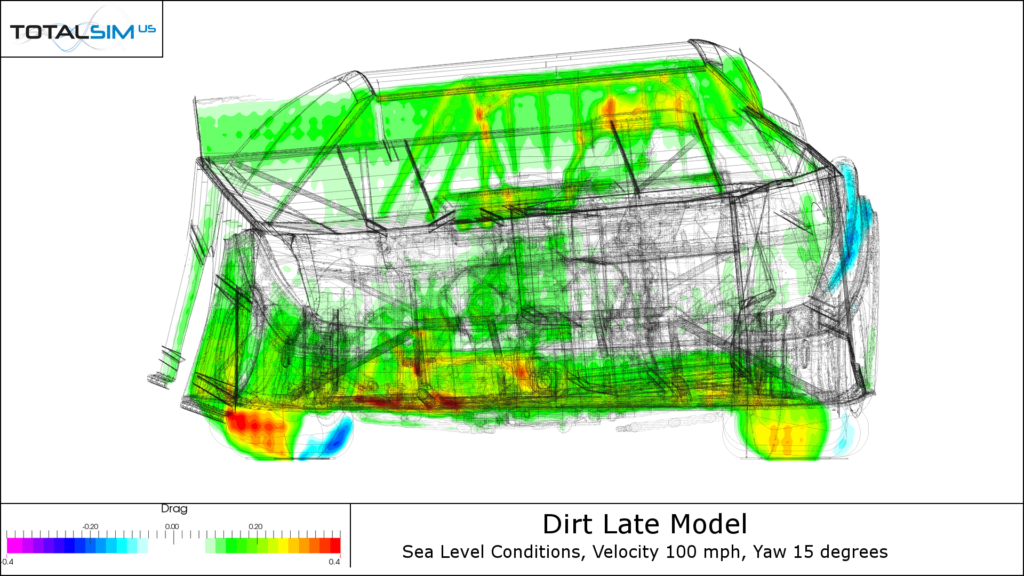
We can also look at where the drag is being created using a Drag X-Ray plot. This gives a head-on view of the car and sums the drag through the vehicle showing us where the drag is created. We see that the bottom of the wheels below the bodywork have the most drag per unit area and can also see the nose and the spoiler drag and slight thrust on the driver-side fender we saw previously in the CpX plots.
CpZ Plots
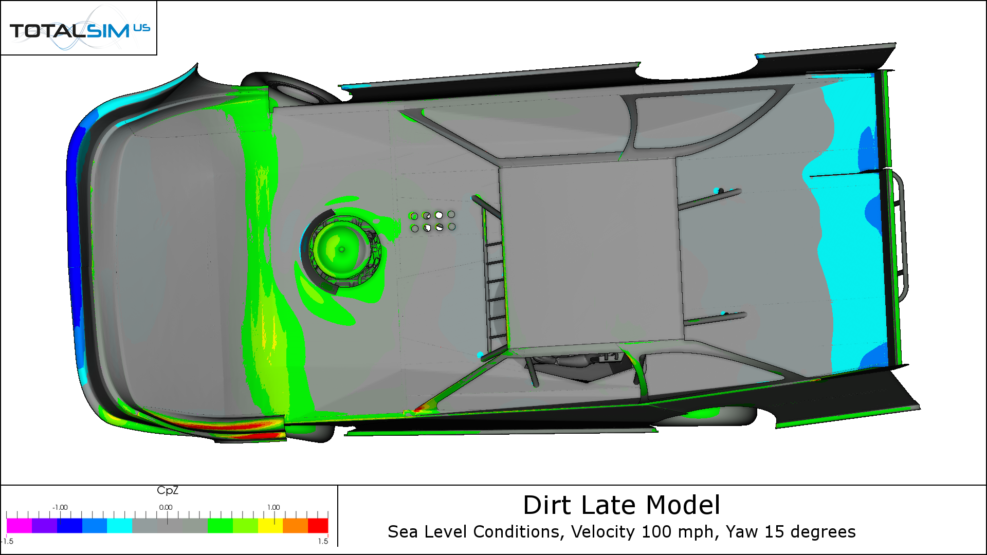
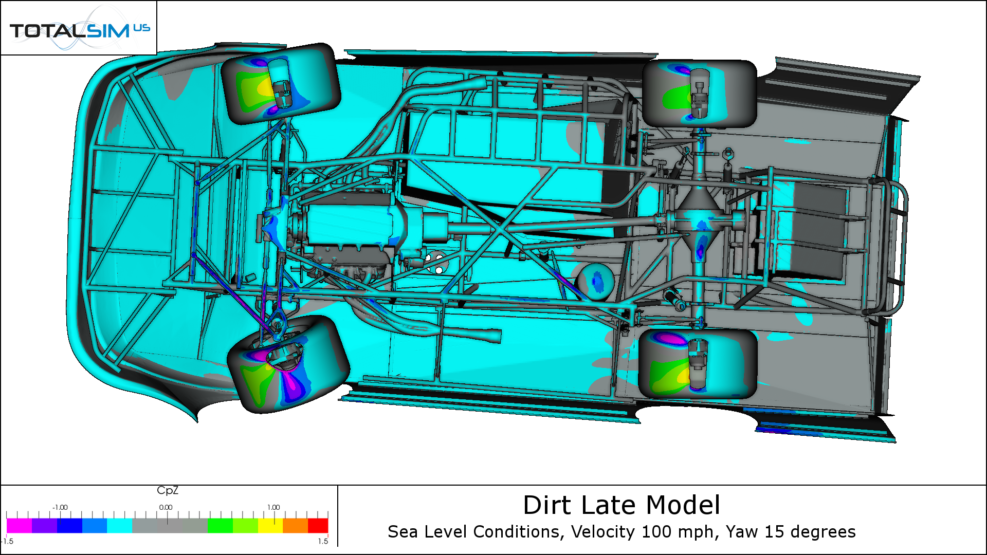
In the the CpZ plots above, we are isolating the pressures effects that are acting vertically. Negative CpZ (blues and purples) shows the surfaces that are creating downforce (negative lift) while positive CpZ (reds and yellows) shows regions of lift. The blue color on the top side of the splitter and the rear deck ahead of the spoiler show where the upper body is creating downforce. Looking under the car we also see a significant amount of downforce coming from the underbody. Reassuringly there is not too much lift being generated with the only significant contributions coming from the hood and the diver-side fender.
Downforce X-Ray
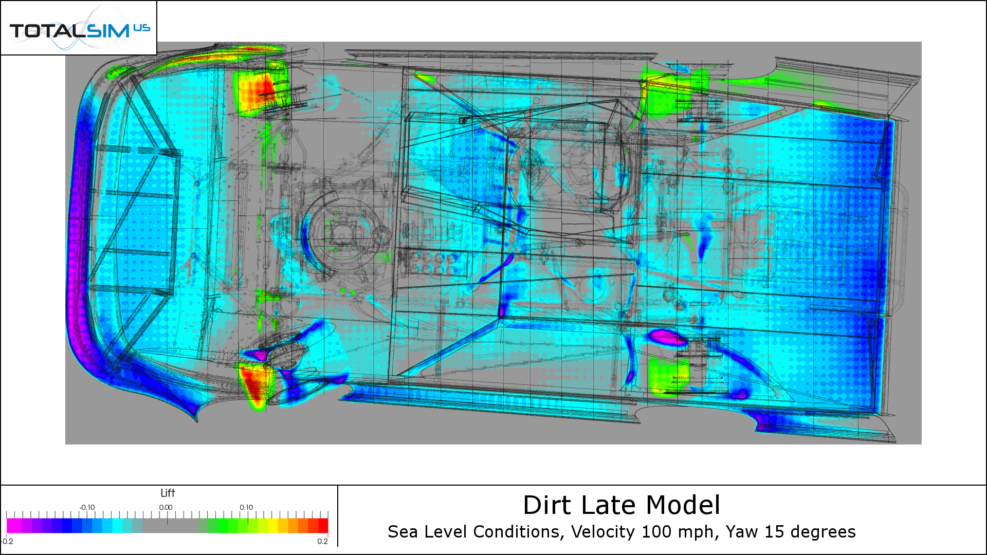
The top view of the vehicle shown in this Downforce X-Ray plot depicts where lift and downforce are created on the vehicle and shows how they are summed to create the downforce distribution. As seen in the CpZ plots, we can see downforce at the splitter and rear deck ahead of the spoiler (blue and purple). We can also see some lift on the wheels (red and yellow) which is typical on both open and closed wheel race cars.
CpY Plots
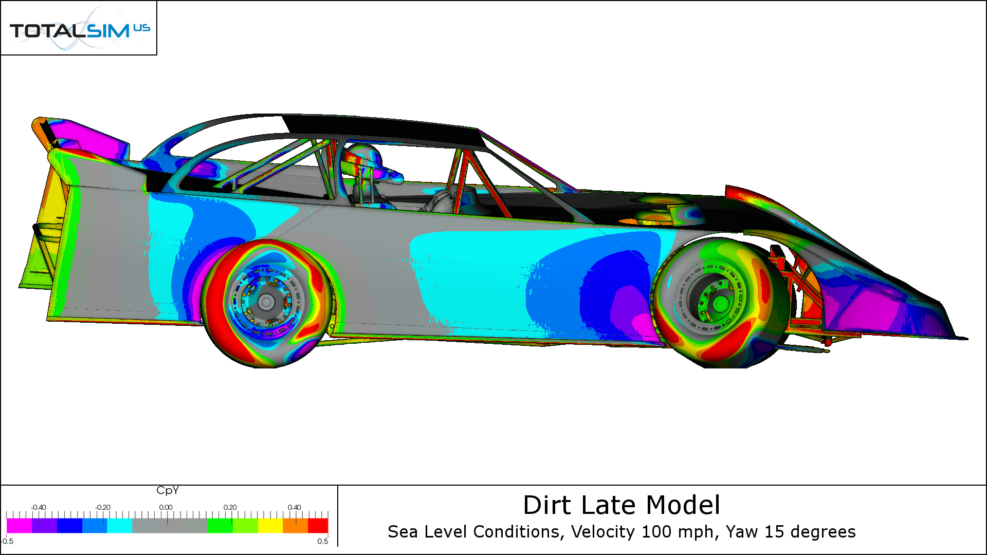
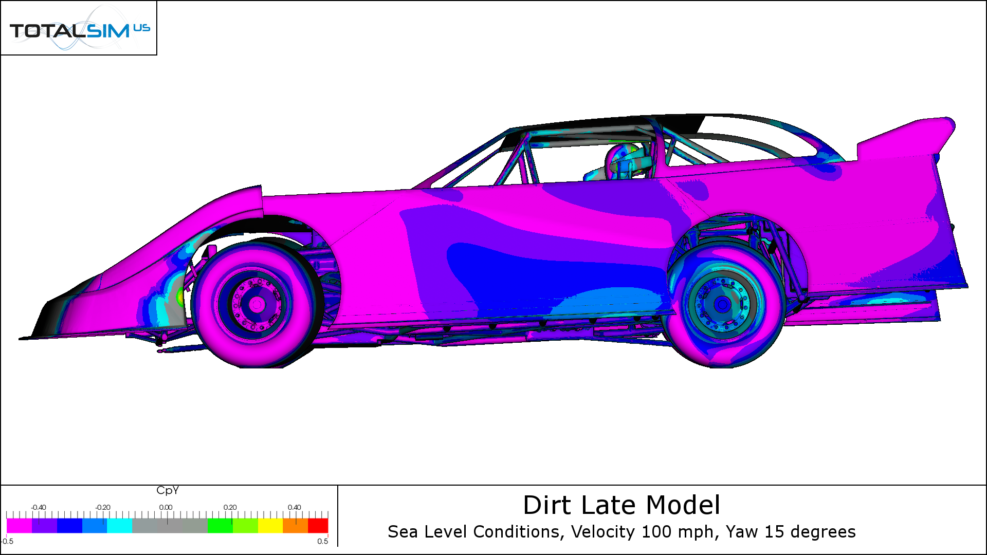
The CpY plot isolates the pressure effects that create the sideforce. Here the colors show the direction the sideforce is acting, with reds and yellows showing forces acting to the right (de-stabilizing) and blues and purples to the left (stabilizing) as the driver sees them. Above we see the right-hand side nose and front fender and the entire left-hand side of the vehicle creating a force pointing towards the center of the corner, counteracting the slip of the vehicle allowing it to maintaining traction at high speed.
Sideforce X-Ray
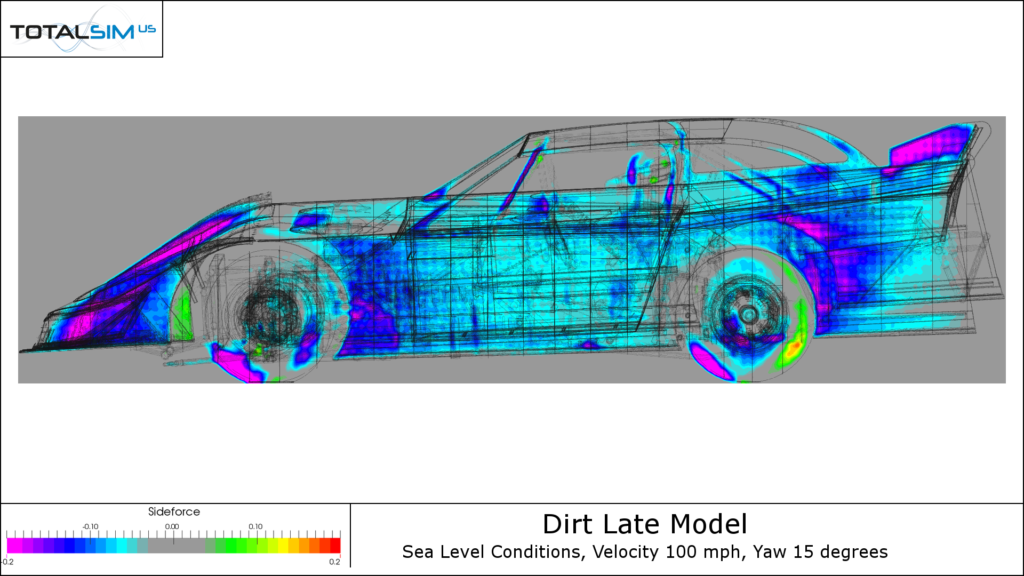
The Sideforce X-Ray shows good sideforce production across the entire length of the vehicle. Again like the drag and downforce X-Rays this plot show the sum of the forces in the side or lateral direction. The blue coloration means the sideforce is acting towards the center of the turn (left) and is acting to hold the car in the corner, keeping it stable, along wiht the downforce this allows Matt to corner at higher speeds.
Skin Friction Plots
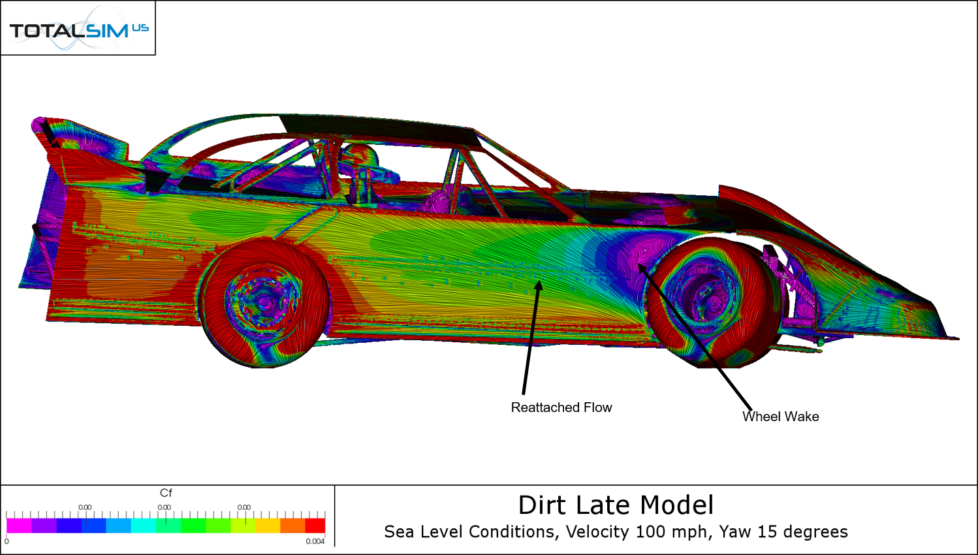
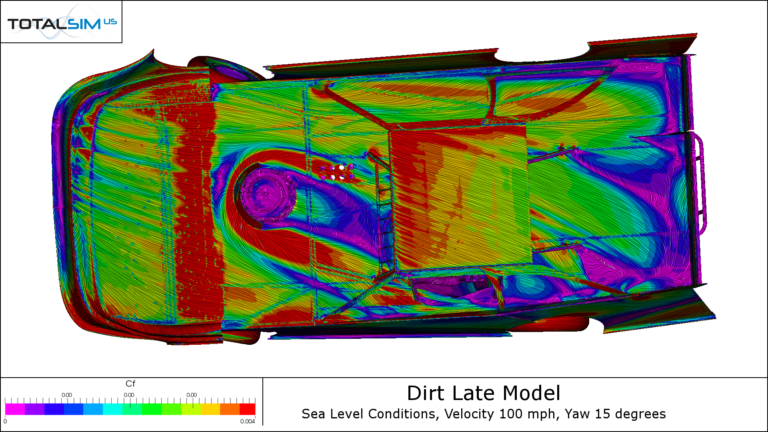
To understand how the air is moving at the surface of the vehicle we can look at the shear stress or skin friction plots. Reds and yellows show where the flow is healthy and strong on the surface, blues show where it is weak, and purples where it has separated and is no longer attached to the surface. The “oil flow” lines in these plots also allow us to see the direction of the flow on the surface. The plots above show some poor flow on to the spoiler and on the fenders. Fixing these would improve the downforce and sideforce respectively.
Volume Streamlines
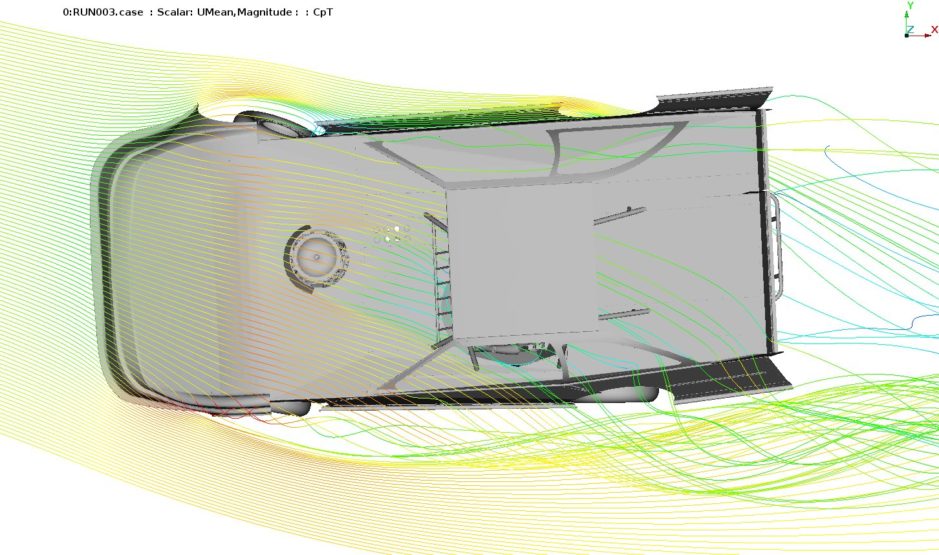
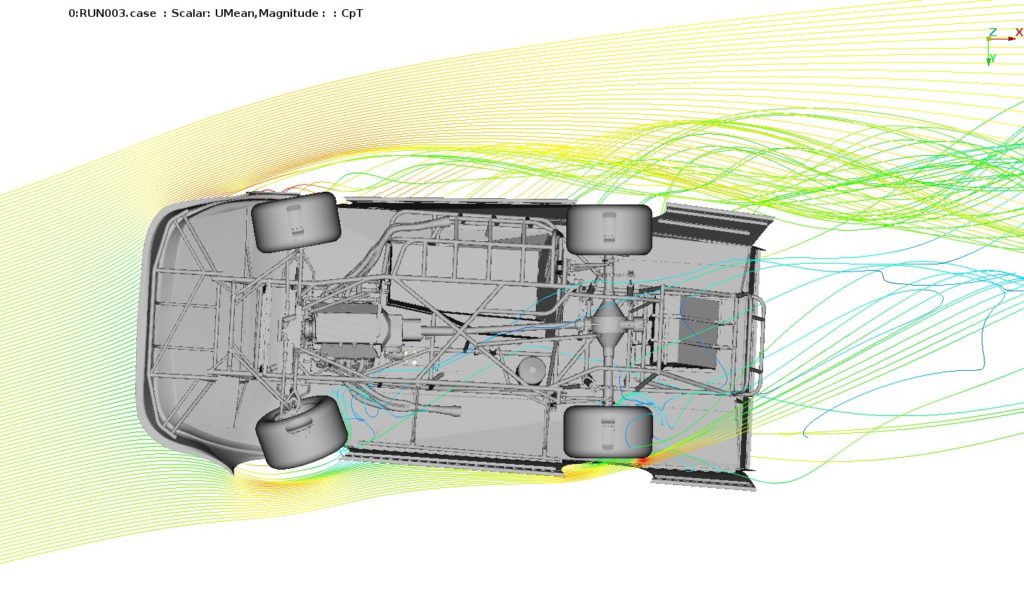
The streamlines act as tracers showing how the air is moving across the vehicle. We see the air coming from the right-hand side as the car slides through the left-hand turn at 15 degrees yaw. It flows cleanly across the nose and spins up a large vortex as is rises up over the left-hand side fender. We can also see the influence of the air exiting the wheel wells deflecting the streamlines.
Concluding Remarks
The aerodynamic data generated through TS Auto shows why and how the shape of Matt’s Dirt Late Model car helps him corner at high speed on the slippery dirt tracks he races on. The asymmetric nose, angled fenders and large rear spoiler act to create downforce and sideforce which improves his traction and stabilizes the car in the corner. Flow on to the spoiler can be improved, and with further work on the fenders and nose increased downforce and performance will be found, allowing for faster speeds, quicker lap times… and more wins!
About TS Auto Application
TotalSim has developed a series of “pay-as-you-go” web application that are accessible via a custom web portal. All of the Apps are based on the internal TotalSim workflows and recipes. TS Auto is a web-based application for performing highly accurate CFD simulations on auto vehicles including concept cars, OEM, and all types of race cars. The App will automate your entire CFD process from meshing to setting up the CFD solver to generate post-processing data. All you have to do is to upload geometry and input basic run settings. The App also includes a suite of post-processing tools for you to easily analyze the results. Please visit our TS Auto page for more information.
About TotalSim
Founded in 2009, TotalSim US is a full-service computational fluid dynamics (CFD) consulting and solutions group providing decades of engineering expertise and insight to top organizations in the automotive, racing, aerospace and industrial industries. TotalSim is headquartered in Dublin, Ohio, with an additional office in Pasadena, California. Together with our sister company, TotalSim UK in Brackley, England we are able to serve clients’ global needs.
What we do
We use cutting-edge technology to help you solve your most complex engineering problems. With decades of experience in aerodynamics and design, our goal is to assist you in taking your ideas from initial concept to high performance reality.
In addition to CFD consulting and custom software, we offer industry-specific applications, training, support and hardware to ensure your product is performance-ready.
What makes us different?
We are a relationship-driven company that:
- Accelerates every stage of design and development through automated CFD calculations and workflows.
- Simplifies complex CFD processes to empower our clients’ success.
- Empowers clients at every stage with solver-agnostic solutions, support and training.
- Customizes CFD tools and provides simulation apps tailored to automotive, truck and aerospace designs.
Credits
[1] Photos copyright ‘Photos by Boyd’ used with permission
[2] Dirt Late Model CAD file created by Matthew Furman

